Historical Review of Delmarva Power Electric Residential Rates
Independently Prepared by Delaware Division of the Public Advocate
Date: April 6, 2026
Executive Summary
Delmarva Power and Light (DPL) is Delaware’s largest electric utility and only Public Service Commission (PSC) regulated electric utility. This report analyzes the last two decades of DPL electric rates by dividing them into their three largest categories – Distribution, Supply, and Transmission – focusing on the Residential “R” and Residential Space Heating “RSH” rate classes. The rates presented in this document were sourced from the Compliance Fillings associated with each rate increase request filed by DPL with the PSC (in filing systems Delafile and Easyfile) and DPL’s Infrastructure Safety and Reliability Plan.
The findings in this report show an overall increase in rates since 2005. Distribution rates have doubled for residential customers over the last 20 years, driven by a significant increase in infrastructure spending. Transmission rates held largely steady from 2014-2020, but have doubled since 2020. Supply rates decreased from 2010 through 2020, helping to offset increases in the other rate components. But Supply rates have increased by 87% – 103% since 2020, depending on rate class and season. In other words, prior to 2020, increases in Distribution rates were offset by a decrease in Supply rates while Transmission rates held steady. Since 2020, however, all three rate components have increased dramatically, driving up DPL customers’ total electricity bills.
Key Findings
- Since 2009, the Commission has approved a total of $153 million in annual revenue increases for DPL, meaning an additional $153 million is paid by DPL electric customers to DPL now as compared to 2009 (these Distribution rate increases are separate from any Transmission or Supply increases).
- DPL’s December 2022 rate increase request was its largest, seeking a $72.3 million increase and being awarded a $42.5 million increase. DPL’s December 2025 rate increase request is its second largest, seeking $67.8 million, which is still pending.
- Since 2009, DPL has filed eight base rate increase requests. The rate increases awarded by the PSC average $21.9 million increase per filing.
- Since 2021, DPL’s annual spending on infrastructure, has increased by 67.2%. Utilities seek to recover such investments through the rates paid by customers.
- Distribution rates have more than doubled for both Residential and Residential Space Heating customers since 2006.
- Supply rates declined from 2010 through 2020. Since 2021, however, Supply rates have doubled for both Residential and Residential Space Heating Customers.
- For Residential customers summer rates have increased by 114.1% since 2021 (from $0.052148/kWh in 2021 to $0.111063/kWh in 2026). Winter rates have increased by 92.4% since 2021 (from $0.059285/kWh to $0.114049/kWh in 2026).
- For Residential Space Heating customers summer rates have increased by 114.6% since 2021 (from $0.051753/kWh in 2021 to $110159/kWh in 2026). Winter rates have increased by 96.9% since 2021 (from $0.051041/kWh in 2021 to $0.1005155/kWh in 2026).
- Transmission rates showed little variation from 2014 through 2020. Since 2020, DPL transmission rates increased by 93.5% (from $2.99/kW in 2020 to $5.78262/kW in 2025) for both rate classes.
Introduction
Electric bills in Delaware have increased significantly in recent years, consistent with a trend of rising energy costs across the country. Customers and policymakers question if energy costs have reached an unsustainable level. To try to find policy solutions to this energy affordability crisis, it is imperative to understand how we got here.
DPL is Delaware’s largest electric utility serving 344,000 total customers, of which approximately 255,000 are residential customers, throughout Delaware. As a regulated utility, DPL is subject to the oversight of the PSC at the state level and the Federal Energy Regulatory Commission (FERC) at the federal level. The PSC determines the standards for performance and reliability DPL must meet in Delaware and determines the Distribution rates DPL may charge its customers. Customers’ monthly electric bills consist of three main rate categories: Distribution, Supply, and Transmission as well as several additional surcharges not discussed in this report.
Distribution rates are shaped by local factors and proceedings. These rates account for the costs of operating, maintaining, and improving DPL’s local low-voltage distribution grid and are tied by DPL’s spending on infrastructure. Distribution rates are established through applications to increase rates (also referred to as base rate cases or general rate cases) filed by DPL with the PSC. In a base rate case, Delmarva will request an increase in the revenue it should receive from Delaware customers to recover the costs of its investments, plus a rate of return (similar to profit), and its expenses to deliver electricity to customers. Rate cases are resolved through an order of the PSC that determines the amount of revenue from customers DPL is given the opportunity to recover and establish new Distribution rates until the next base rate case is filed. DPL filed its latest rate increase request in December 2025 seeking an annual increase in revenue from customers of $67.8 million.
Supply rates and Transmission rates are influenced by factors outside of the State. For customers on DPL Standard Offer Service (SOS), rates are determined through an annual competitive auction overseen by the PSC in which DPL purchases power from power generators to deliver electricity to Delaware customers. These rates apply to DPL electric customers who have elected not to contract with a third-party electric supplier.
Delaware is within the footprint served by PJM Interconnection, LLC (PJM), the regional transmission organization that manages the electric transmission grid and wholesale power markets. Transmission rates are set through cost allocations determined by PJM and approved by FERC for usage of the high-voltage transmission grid. They are a function of both the costs of DPL’s transmission infrastructure in Delaware and the costs of the transmission infrastructure throughout the PJM region.
Prior to January 2026, the Delaware PSC used the business judgement standard to determine which infrastructure investments could be recovered through base rates. Delaware was one of the only states continuing to rely on this standard, which gives significant deference to utilities in reviewing their spending decisions, limiting the PSC’s ability to deny utility recovery of costs so long as they were in the utility’s reasonable business judgment. DPL’s rate base increased substantially during recent base rate cases governed by the business judgement standard. As stated in the summary for Senate Bill No. 59 (2025):
For example, a utility [like Delmarva] may decide to expand the size of its facilities, but overbuilds those facilities at a cost of $3 million, even though a smaller $1 million expansion would be adequate to serve its customers and anticipated future growth. Under the business judgment rule, the Public Service Commission is not able to deny recovery of any part of the cost of the expanded facility.
SB 59 was enacted into law in 2025 with an effective date of January 1, 2026, after which the PSC will evaluate utility rate base rate cases, and spending decisions, under the prudence standard, allowing the PSC to deny, in whole or in part, any expenses or investments it finds were incurred imprudently.
Since 2018, PSC regulations require that DPL file an annual Infrastructure, Safety and Reliability (ISR) Plan detailing its proposed upcoming three-year Capital Expenditure Plan. To date, the ISR Plan is an informational filing, giving the PSC visibility into Delmarva’s planned expenditures. Currently the ISR is not subject to an approval process, so DPL does not need permission from PSC to make the investments detailed in the plan. DPL will typically seek to recover the costs of these infrastructure investments in a base rate case.
This report analyzes how the three main rate categories of DPL electric rates – Distribution, Transmission, and Supply – have changed since 2005. Because Distribution rates are influenced by local rate proceedings, this report dives deeper into the factors that impact them, such as the ISR Plan and the increases in revenue awarded to Delmarva through the base rate cases.
Method
The data used for this report were sourced from Compliance Fillings, Tariff Sheets, Orders, and ISR Reports stored within the Public Service Commission’s two docketing and E-filing systems: Delafile and Easyfile. These documents were all marked as public. Delafile is the current E-filing system used by the PSC since 2014. From 2005 through the end of 2013, all filings were stored in Easyfile. It should be noted that both the Supply and Distribution rates were sourced from dockets going back to 2006. This is not the case for Transmission rates and the ISR Plans, for which less historical data was able to be sourced. Transmission rate compliance filings were located back to 2014, and thus Transmission trends shown in this report reflect Transmission rate changes since 2014. ISR Plans analyzed in this report date back only to 2021.
Distribution Rates
Rate Case Summary
Distribution rates account for the costs associated with operating and maintaining the Delmarva distribution grid and they are settled through base rate cases. All rates prior to 2005 are outside the scope of this report. Graph 1 and Table 1 compare the revenue increases requested by DPL to the amounts ultimately awarded by the PSC. Delmarva filed its latest rate increase request in December 2025 seeking to increase its annual revenue by an additional $67.8 million. This proceeding is ongoing as of the publication of this report.
Revenue Increases requested by DPL compared to the awarded income by the PSC
| Date Filed | Utility Request (as filed) | Updated Request | Awarded Increase | % Reduction from Request | Rate Effective Date |
|---|---|---|---|---|---|
| 9/18/2009 | $27,600,000 | $26,200,000 | $16,695,000 | 39.51% | 2/1/2011 |
| 12/2/2011 | $31,760,741 | $33,186,072 | $23,152,791 | 27.10% | 1/1/2013 |
| 4/16/2013 | $42,044,000 | $38,976,366 | $15,096,574 | 64.09% | 5/1/2014 |
| 5/17/2016 | $62,766,280 | $60,235,194 | $31,500,000 | 49.81% | 6/1/2017 |
| 8/17/2017 | $31,198,425 | $12,603,795 | $6,850,000 | 78.04% | 9/1/2018 |
| 3/6/2020 | $24,295,085 | $26,915,207 | $17,724,252 | 27.05% | 9/17/2021 |
| 12/15/2022 | $72,341,417 | $55,546,386 | $42,500,000 | 41.25% | 4/24/2024 |
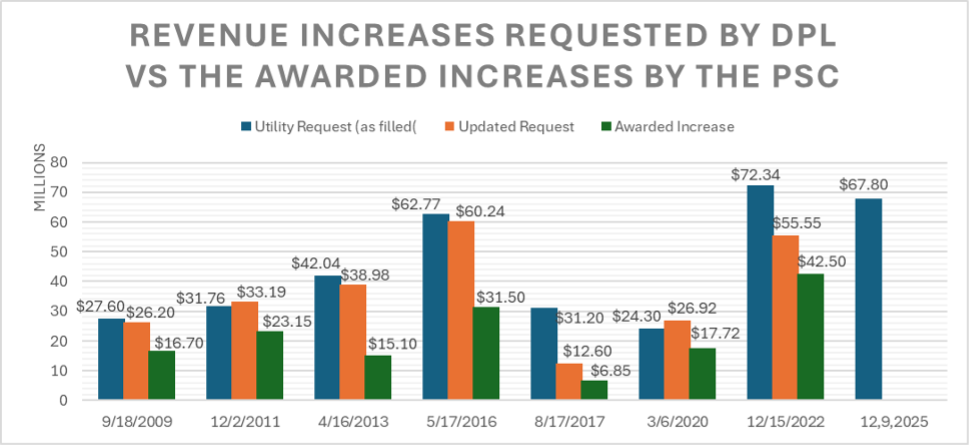
- In DPL’s seven most recent base rate cases, the PSC has awarded a total of $153 million in increases in annual distribution revenue since 2009; averaging an increase of $21 million per base rate case.
- This means $153 million more paid annually by DPL’s 344,000 residential, commercial, and industrial electric customers to DPL in distribution rates in 2025 as compared to 2009. (This total does not include supply, transmission, or other surcharges.)
- On average, the amount awarded by the PSC was 46.7% lower than the amount requested by DPL.
Infrastructure, Safety, and Reliability Plans
Each year DPL presents a three-year Infrastructure, Safety and Reliability plan (ISR) to the PSC, detailing the investments the utility views as necessary to preserve and improve reliability and meet customer demand. The ISR plan details the upcoming Capital Projects and their respective budgets, as well as Inspection and Maintenance, and Vegetation Management expenses. An updated version of each plan is submitted the following year comparing the actual costs incurred for each project with the corresponding budget. DPL can then seek to recover the expenses associated with implementing the projects listed in the ISR Plan through the DSIC or through a future base rate case. Thus, the costs that result from implementing the ISR plan typically drive both the revenue increase requested in each base rate case and the frequency of those requests.
As part of a settlement agreement allowing the merger of DPL into Exelon in 2015, DPL agreed to a $225 million limit on infrastructure spending from 2015 through 2019. That infrastructure spending cap was not extended beyond 2019. A partial spending cap was agreed in the 2022 rate case for the years 2024 and 2025. Figure 2 shows DPL’s ISR spending from 2021 to 2025, as well as its projected spending for 2025-2027.
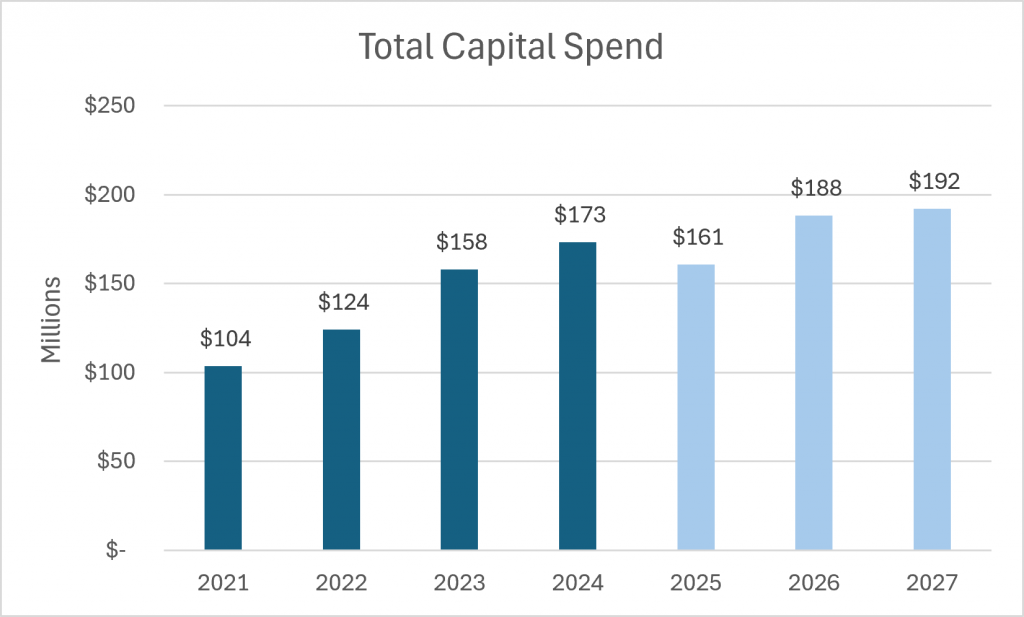
- From 2021 to 2024 DPL increased its Total Capital Spend from $103.5 million to $173.1 million, an increase of 67.2%.
- The Non-Mandatory Spending portion of DPL’s ISR spending has seen an increase of $32.8 million, or 72.1%.
- DPL is projecting to spend another $541 million from 2025 to 2027.
Distribution Rates
Distribution rates, also referred to as Delivery rates, consist of two key charges, the Customer Charge and Distribution rates. Figure 3 illustrates the monthly Customer Charge effective for Residential and Residential Space Heating rate classes. The Customer Charge is a fixed monthly fee associated with the cost of providing service and keeping the electrical connection active This is established through base rate cases.
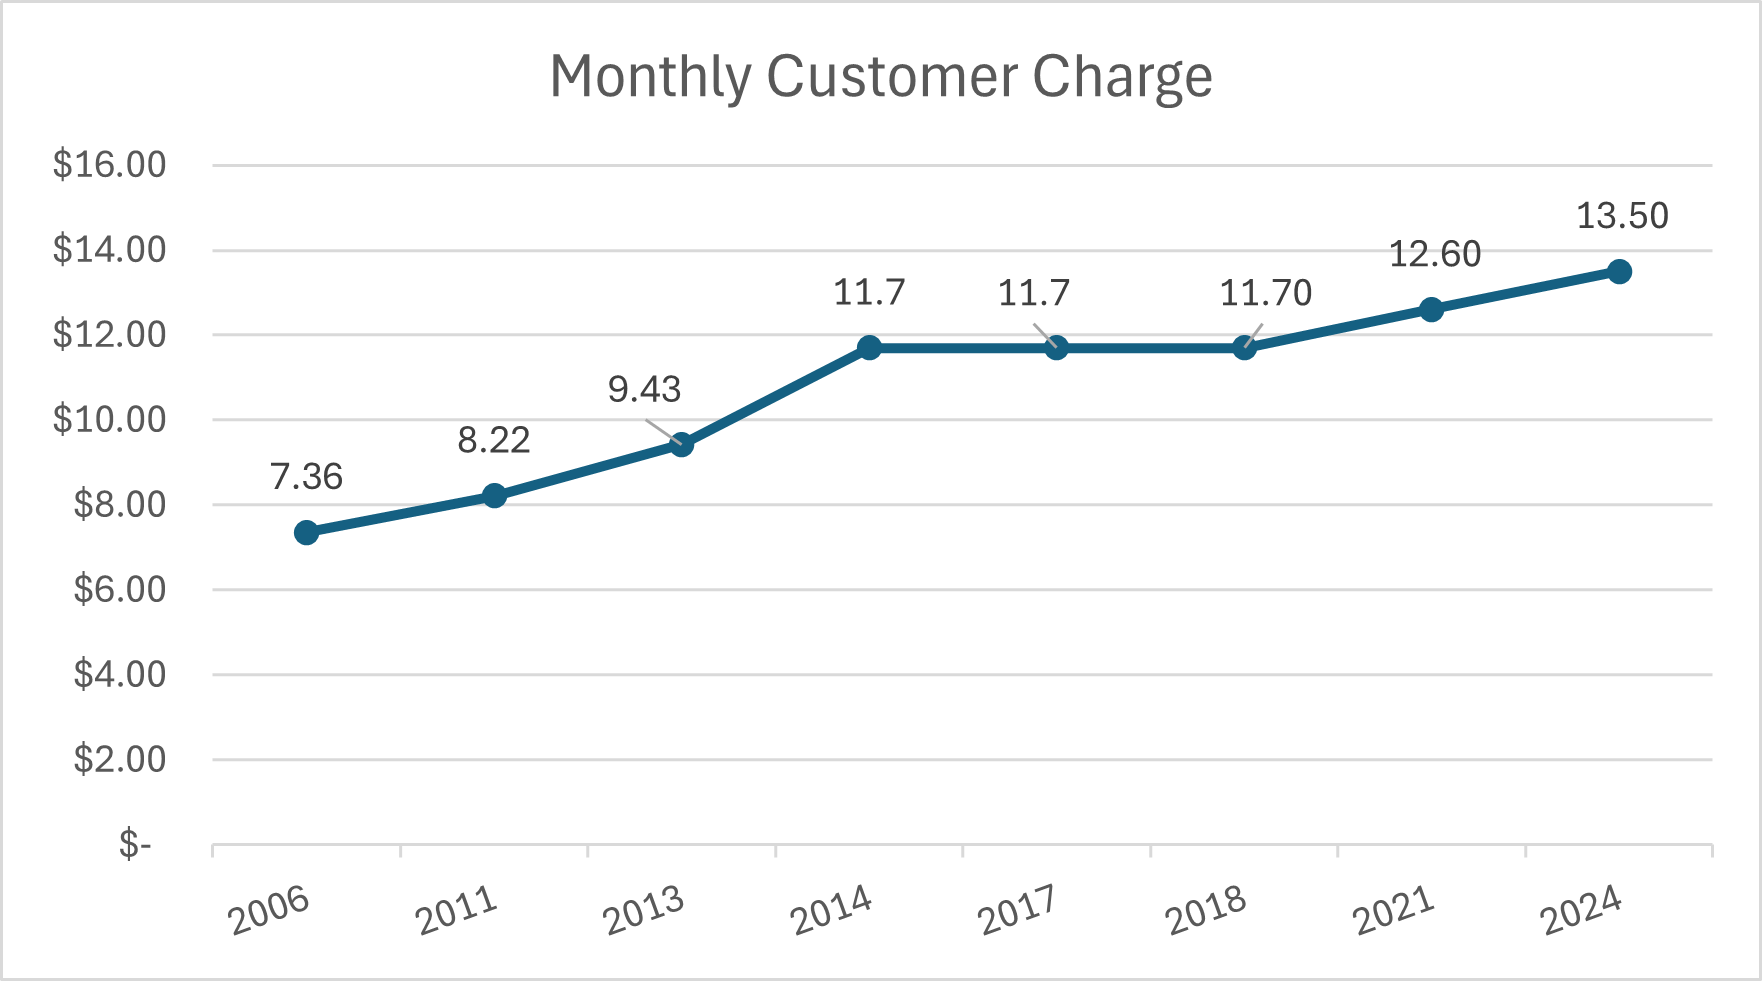
- Customer Charges for Residential and Residential Space Heating customers have increased from $7.36 in 2006 to $13.50 in 2025, representing an increase of 83.42% since 2006.
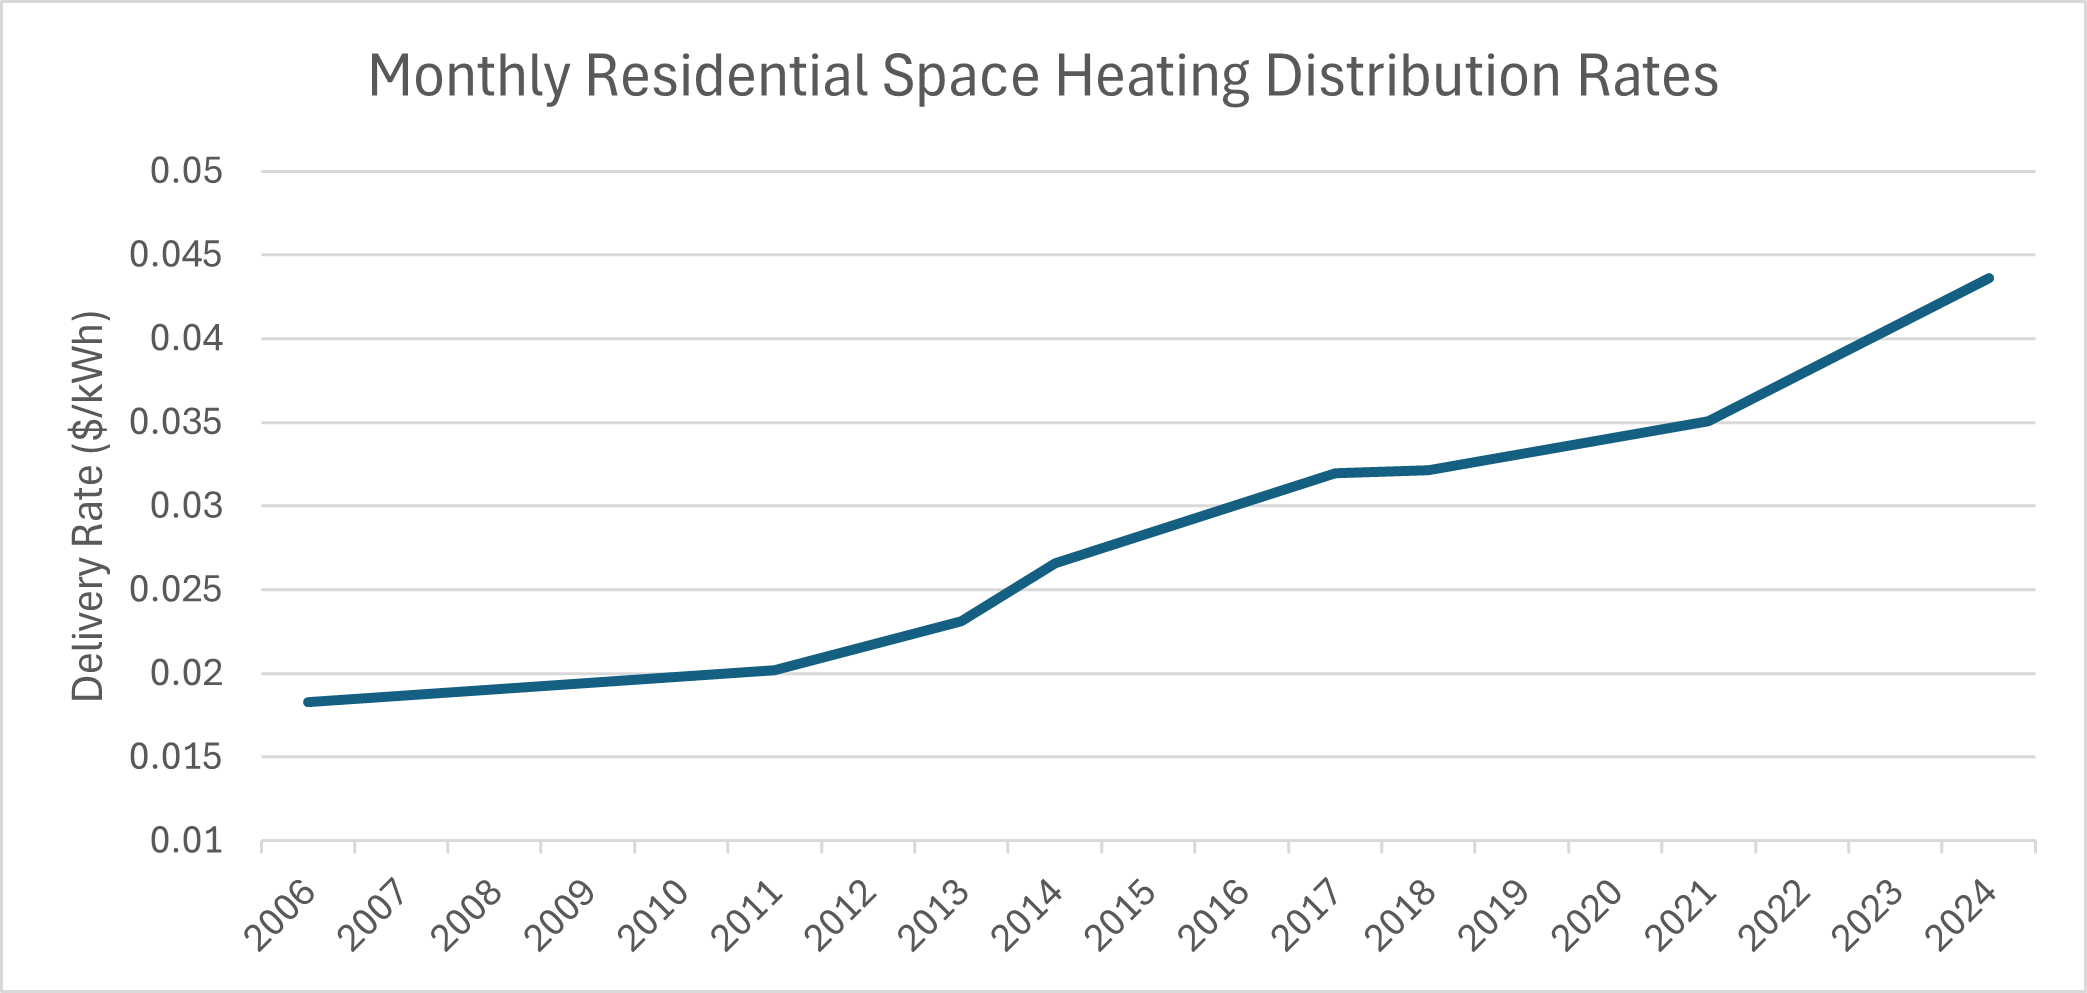
Figures 4 and 5 illustrate the Monthly Distribution rate for Residential and Residential Space Heating Rate Classes respectively. Distribution rates are charged on a per kilowatt hour basis ($/kWh) and do not change between usage tiers and seasons. Like the Customer Charge, Distribution rates are established through base rate cases.
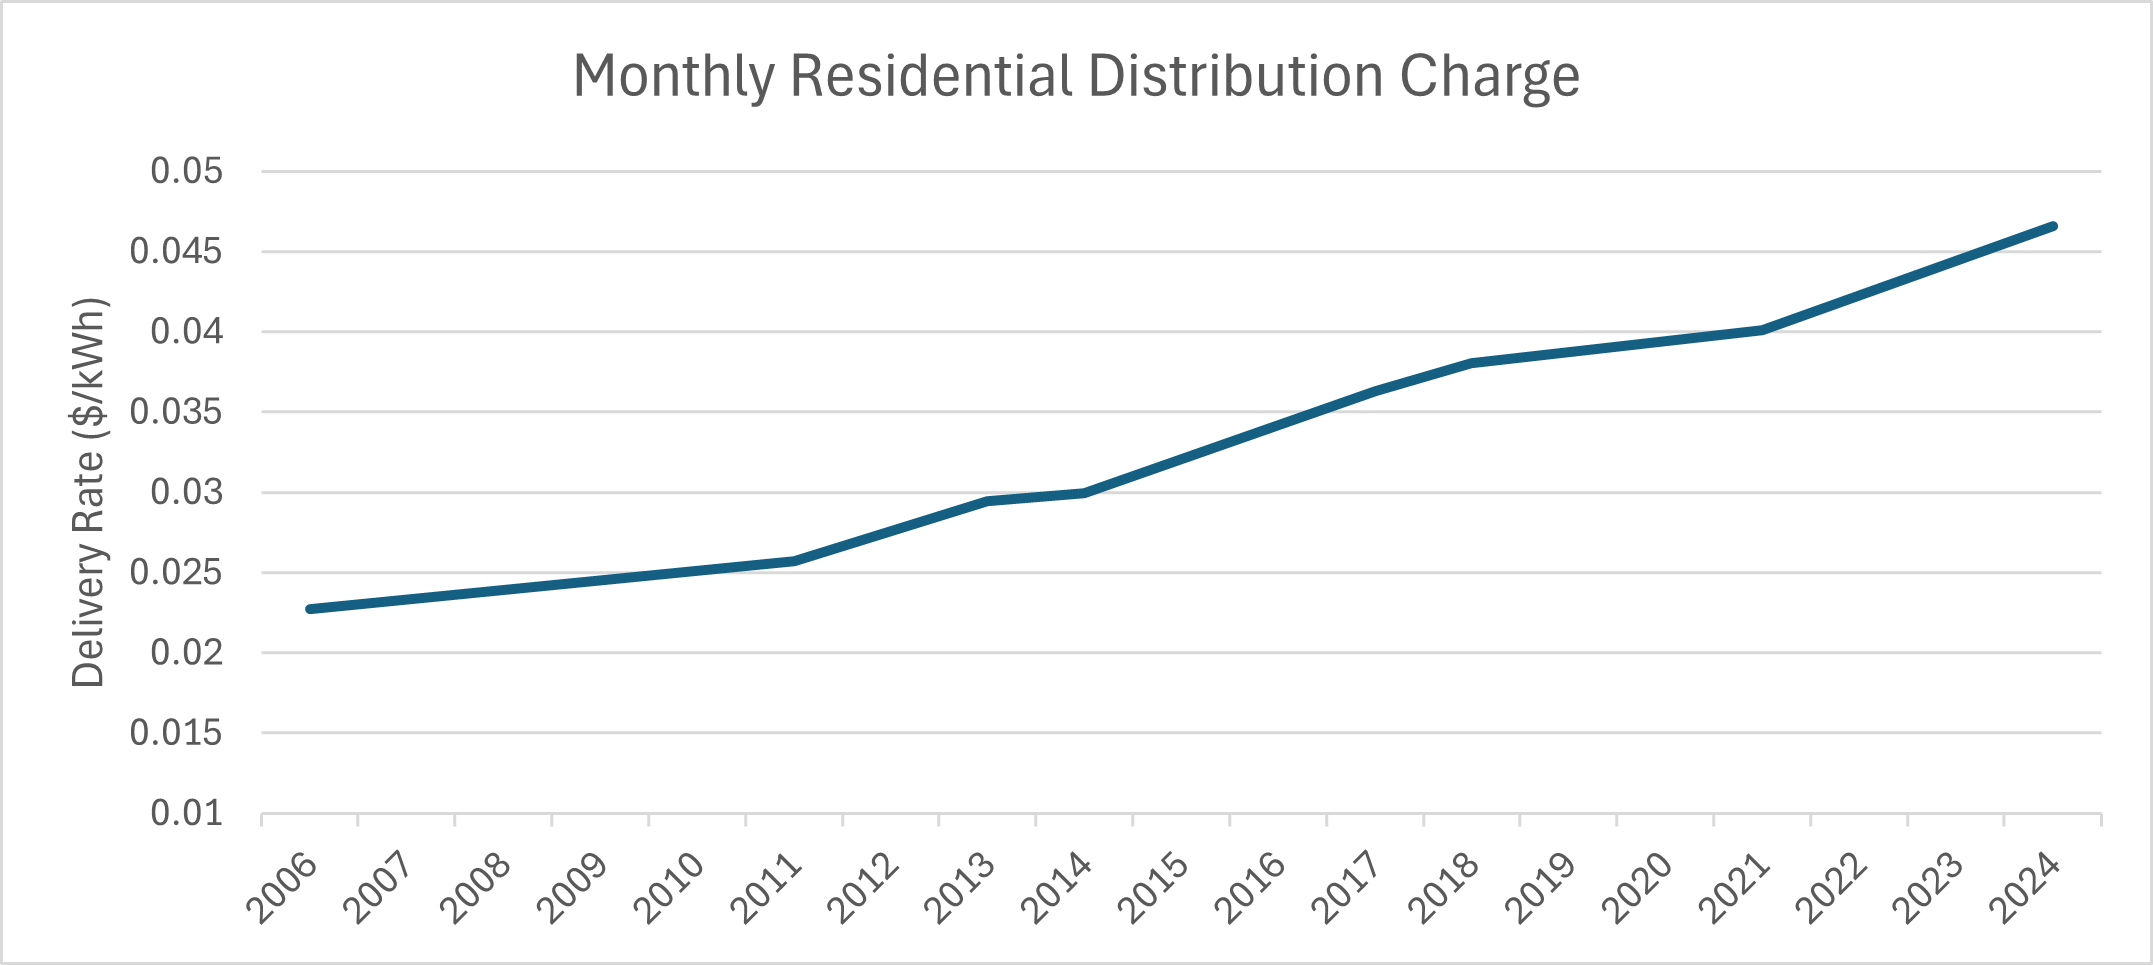
- Distribution rates for Residential customers have increased from $0.022703/kWh in 2006 to $0.046594/kWh in 2025, representing an increase of 105.2%.
- Distribution rates for Residential Space Heating customers have increased from $0.018262/kWh in 2006 to $0.043606/kWh in 2025, representing an increase of 138.8%.
Supply Rates
Standard Offer Service (SOS) rates reflect the cost of procuring electricity on behalf of customers who do not choose a competitive retail supplier. DPL procures electricity for SOS customers through competitive auctions run by DPL under PSC supervision. Each SOS auction is reviewed by an independent expert. SOS costs are mostly driven by PJM wholesale market conditions and are passed on to consumers through SOS rates. These rates are adjusted annually, effective June 1 based on the auction results. There are two usage tiers for Residential customers: the First 500 kWh and Excess kWh (i.e. anything over 500 kWh). Residential Space Heating also has two usage tiers: First 1200 kWh and Excess kWh (i.e. anything over 1200 kWh).
Summer SOS rates for both Residential and Residential Space Heating customers show an interesting pattern over the time period studied: stable rates between 2006 and 2010, followed by a decline in rates through 2021, and then a sharp increase from 2021 to 2026.
Winter SOS rates used to differ by usage tier for Residential customers prior to 2010. For Residential Space Heating customers, the rates converged in 2013. Winter rates demonstrated greater variation depending on rate class and usage tier prior to 2013, however, once convergence occurs, these rates follow a similar trend to the Summer SOS rates: relatively steady rates between 2006 and 2010, followed by a decline in rates through 2021, and then a sharp increase from 2021 to 2026.
Residential
Figure 6 shows the SOS trends for Residential rate class. Winter rates between usage tiers converge in 2010.
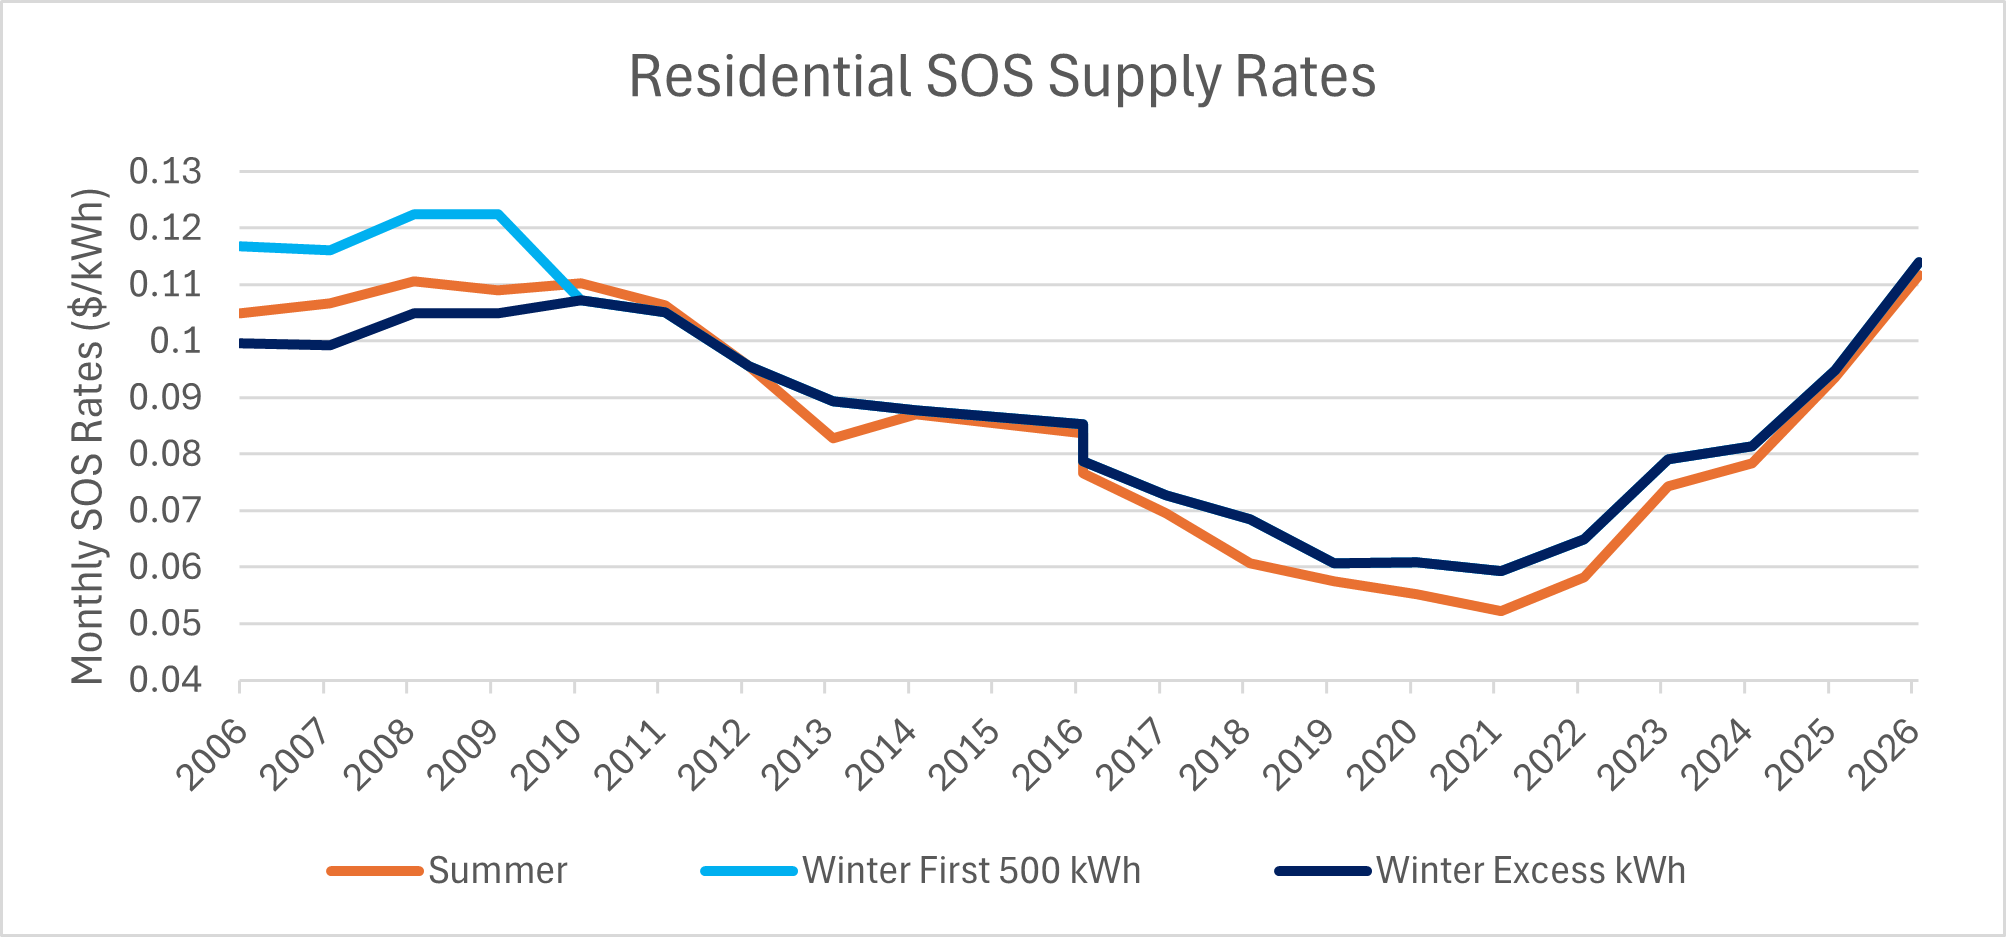
- Summer Rates start at $0.106792/kWh in 2006, then decline from $0.110303/kWh in 2010 to $0.052148/kWh in 2021 (the lowest amount observed). Afterwards, rates increase rapidly, reaching $0.111063/kWh in 2026.
- Winter rates showed an overall decline until reaching $0.059285/kWh in 2021, followed by a rapid increase to $0.114049/kWh in 2025.
- When comparing 2006 to 2026, Summer rates had an overall increase of 6.30%. Meanwhile First 500 kWh Winter rates had an decrease of 2.4% and Winter Excess kWh had an increase of 14.5%.
- However, from 2021 to 2026, Summer rates increased by 114.1% and Winter rates increased by 92.4%.
Residential Space Heating
Figure 7 shows the trend for RHS customers. Winter SOS rates converge in 2013.
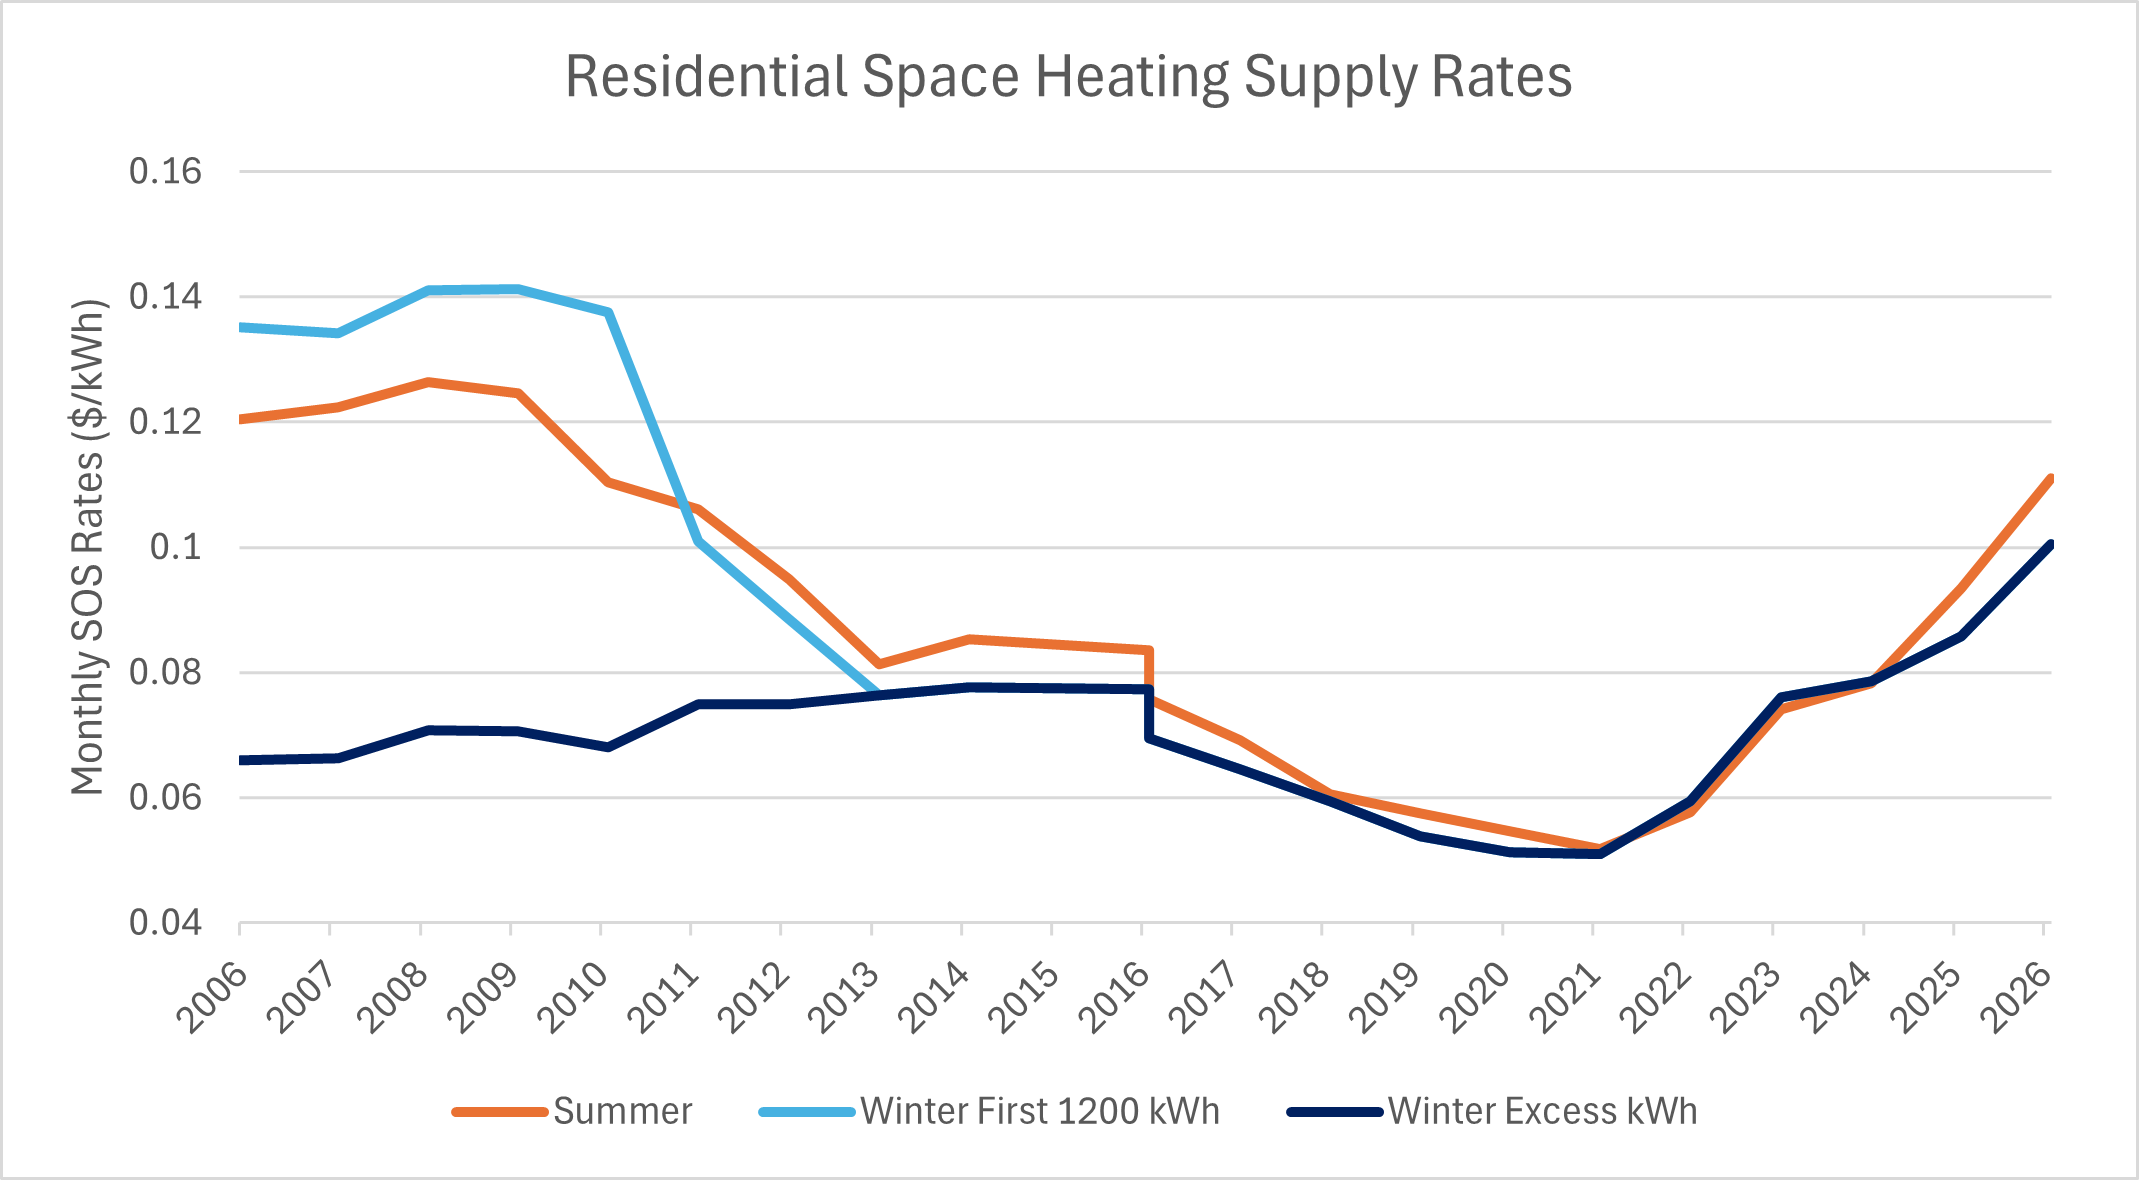
- Prior to converging in 2013, Winter SOS rates for the Excess kWh usage tier increased from $0.06975/kWh to $0.076380/kWh, while the First 1200kWh usage tier went from $0.0135207/kWh to $0.076380/kWh.
- The lowest Winter SOS rates also occurred in 2021 with $0.051041/kWh before rising to $0.100515/kWh in 2026.
- Summer SOS rates present an overall decline from $0.120543/kWh in 2006 to $0.051753/kWh in 2021, then rise to $0.110159/kWh in 2026.
- When comparing 2006 to 2026 Summer SOS rates show an overall decrease of 7.9%.
- When comparing between 2006 and 2026, RHS Winter rates show different outcomes depending on the usage tier. Rates for First 1200kWh usage tier show a reduction of 25.7%. Meanwhile, the Excess kWh usage tier shows an increase of 52.4%.
- From 2021 to 2026, Summer rates increased by 114.6% and Winter rates increased by 96.9%.
Procurement Cost Adjustment
Procurement Cost Adjustment (PCA) costs are charges to reconcile the difference between the forecasted cost of electric supply and the actual costs incurred by DPL. Because the SOS rates are set in advance based on projected market prices, the actual wholesale energy costs may differ from what was expected. Thus, the PCA allows DPL to either return over-collected amounts to customers or recover under-collected supply costs. PCA values are uniform for all rate classes analyzed in this report and are shown in Figure 8.
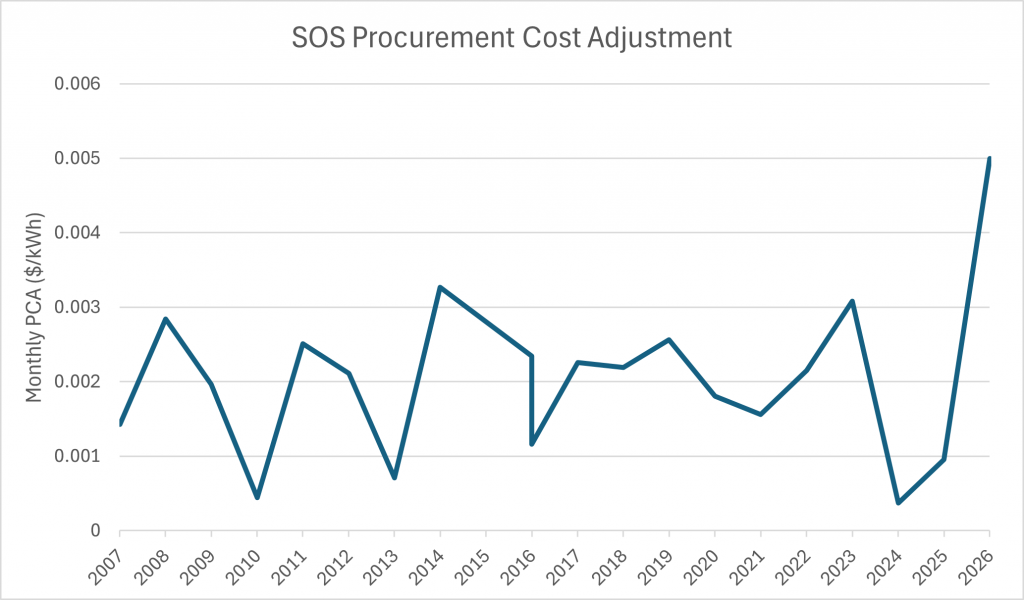
- PCA costs are a reconciliation and represent a small portion of overall costs.
Transmission Rates
Transmission Rates account for the overall cost of using PJM’s regional high-voltage transmission network to transport electricity from out-of-state generation sources to the DPL distribution grid and the in-state transmission network owned by DPL. Transmission costs are allocated through PJM and FERC processes and DPL passes these costs on to consumers using formulas and mechanisms established by PJM.
Transmission rates are uniform for the residential rate classes and usage tiers recorded in this report.
Network Integration Transmission Service Rates from 2020 to 2025
| Rate Effective Date | DPL NITS Rate |
|---|---|
| 12/15/2020 | 31,745.33 |
| 9/1/2021 | 44,498.47 |
| 9/13/2022 | 48,014.92 |
| 9/1/2023 | 53,590.97 |
| 9/1/2024 | 60,191.58 |
| 9/1/2025 | 64,128.77 |
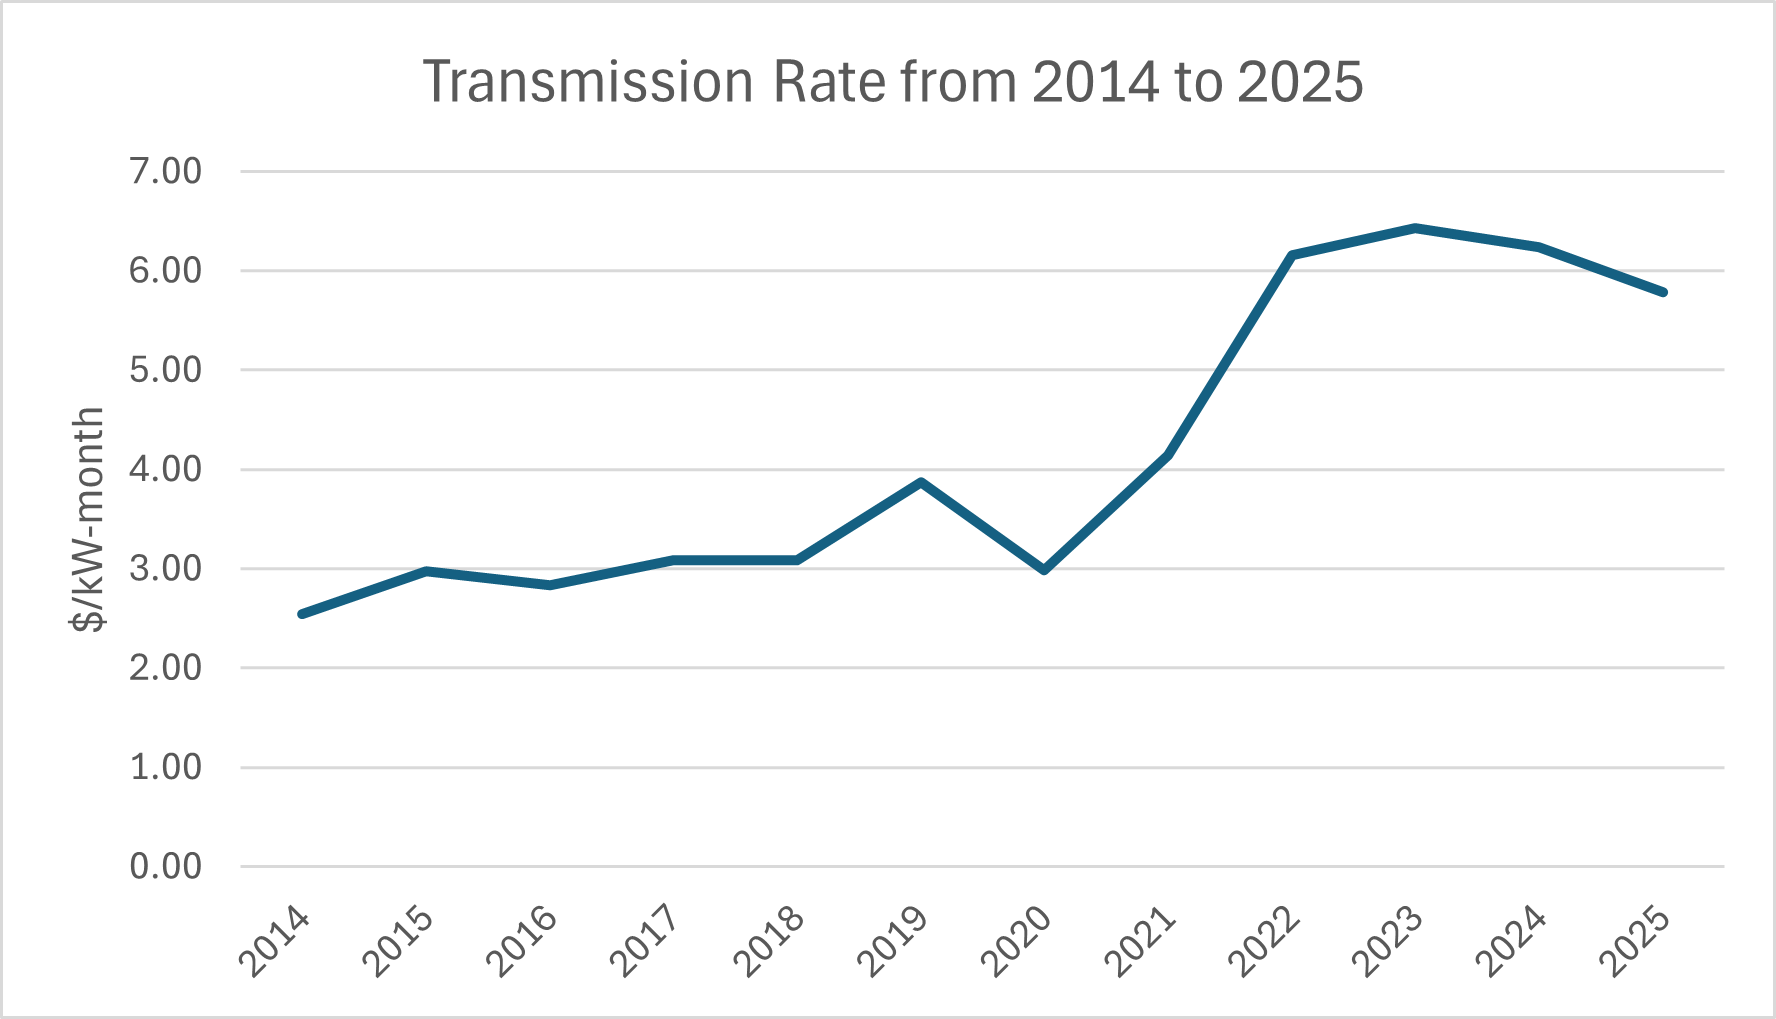
- Transmission rates remained relatively stable between 2014 and 2020 with only a 17.42% increase.
- Transmission rates increased from $2.988634/kW-month in 2020 to $6.156841/kW-month in 2022, then stabilized, with 2025 having a rate of $5.782620/kW-month.
- Overall, Transmission rates have increased by 94.49% in the past ten years.
- Comparing 2020 to 2025, transmission rates have increased 93.5%.
Conclusion
From 2005 to 2025, overall electric rates have increased substantially for both Residential and Residential Space Heating customers. However, the Distribution, Supply, and Transmission rates have followed different trajectories. For most of the study period, decreasing Supply rates substantially offset increasing Distribution and stable Transmission rates. That changed after 2020, however, after which all three rate categories began showing increases compared to the previous decade. Since 2021, DPL’s capital spending has increased by 67.2%., which contributes to increases in rate base and increases in Distribution rates paid by customers. In 2022 and 2025 DPL filed its two largest base rate cases, when the company requested a $72.3 million and a $67.8 million increase in revenue, respectively. Transmission rates have nearly doubled during the past five years. Supply rates have increased more than 90% since 2021. All of these combine to create sustained and compounding electric bill increases for DPL electric customers. These increases become especially concerning during periods of high energy use, such as record-breaking cold winters and intense summers, making energy bills unsustainable for many customers. These rapidly changing costs underscore the importance of strong regulatory oversight to ensure a reliable electric system while striving to ensure basic affordability for DPL customers.